C++, OpenGL
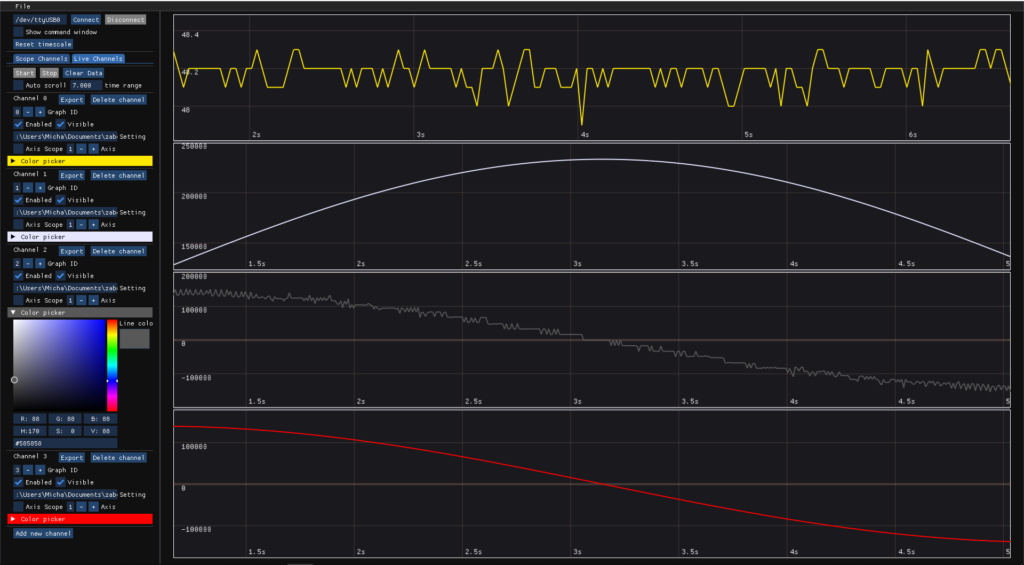
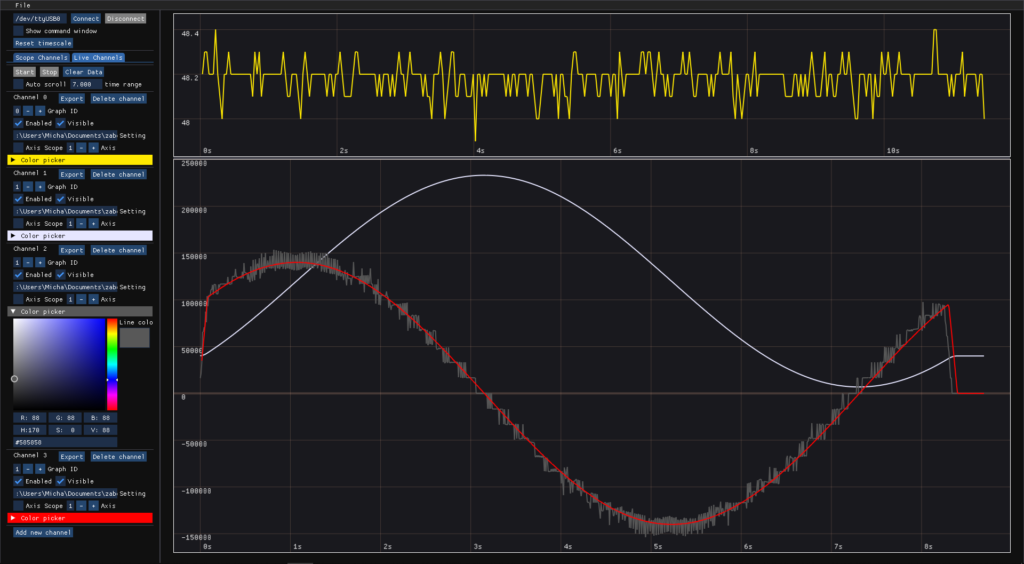
Zaber plotter is intended as an internal tool for analyzing data from Zaber motion control products. It can graph live streamed data in real-time as well as export and recall data from recording sessions.
During my Co-op at Zaber, I noticed how inconvenient it was to plot sensor data. The existing tool only ran on Windows, which meant that you would need to find a Windows computer or virtual machine just to use it. In addition to this, I could think of a variety of useful features that were lacking, and after talking to my coworkers about it, I decided to create my own tool.
Zaber Plotter is designed to run on Linux, but it is fairly cross platform being a C++/OpenGL program with minimal dependencies. The GUI was created using the DearImgui library which I expanded on to create my graph views. Utilizing the immediate mode design of Imgui, the graphs in Zaber Plotter are updated in real-time and can be resized, moved around, scaled, and stretched with no impact on performance.
A major feature of Zaber Plotter is how graphs can be grouped or split apart. If two sensor readings are of a similar range (like encoder and target position), you can graph them together. You can also separately graph another reading with a smaller range (like input voltage). The separate graphs have a shared time scale and will pan together and even compensate their timescales to match the other graph if you zoom in or out.